PCR Troubleshooting and Optimization Figure
|
Edited by: Suzanne Kennedy and Nick Oswald Published: 2011 ISBN: 978-1-904455-72-1 An essential book for all scientists using PCR, real-time PCR, qPCR and related techniques. read more ... |
Figure from: PCR Troubleshooting and Optimization
Full details of this book at PCR Troubleshooting and Optimization. More figures at PCR Figures.
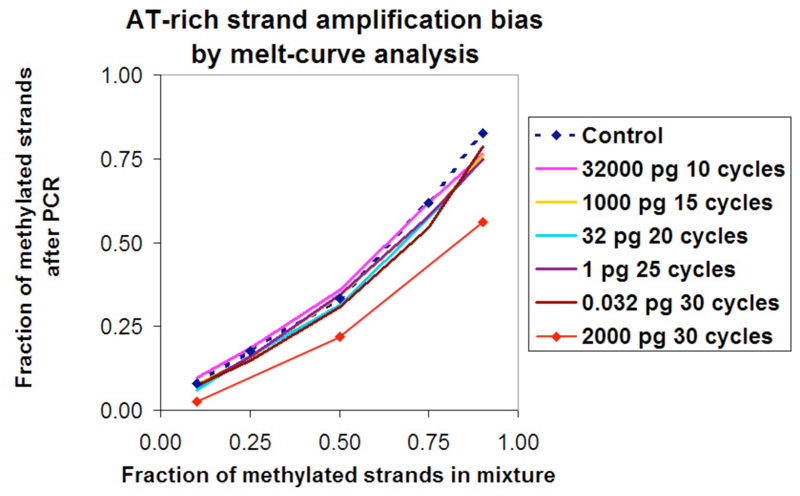
Chapter 9. Figure 7. Amplification bias and minimization in a model system. Plasmid DNA containing an insert corresponding to either a methylated amplicon after bisulfite conversion or a non-methylated, relatively AT-rich, copy of the same amplicon was mixed after separate PCR amplification at fixed ratios to produce the control data. Samples were composed of mixtures of the plasmid templates at fixed mass ratios. Template mass going into PCR and number of cycles were varied yielding a family of curves that were indistinguishable from the control suggesting minimal PCR bias. In contrast, the red curve shows a bias toward the amplification of the AT-rich template at high concentration (2 ng or approx. 4.3 million target copies/reaction) of template and with 30 cycles of PCR.
Further reading at PCR Troubleshooting and Optimization. More figures at PCR Figures.