PCR Troubleshooting and Optimization Figure
|
Edited by: Suzanne Kennedy and Nick Oswald Published: 2011 ISBN: 978-1-904455-72-1 An essential book for all scientists using PCR, real-time PCR, qPCR and related techniques. read more ... |
Figure from: PCR Troubleshooting and Optimization
Full details of this book at PCR Troubleshooting and Optimization. More figures at PCR Figures.
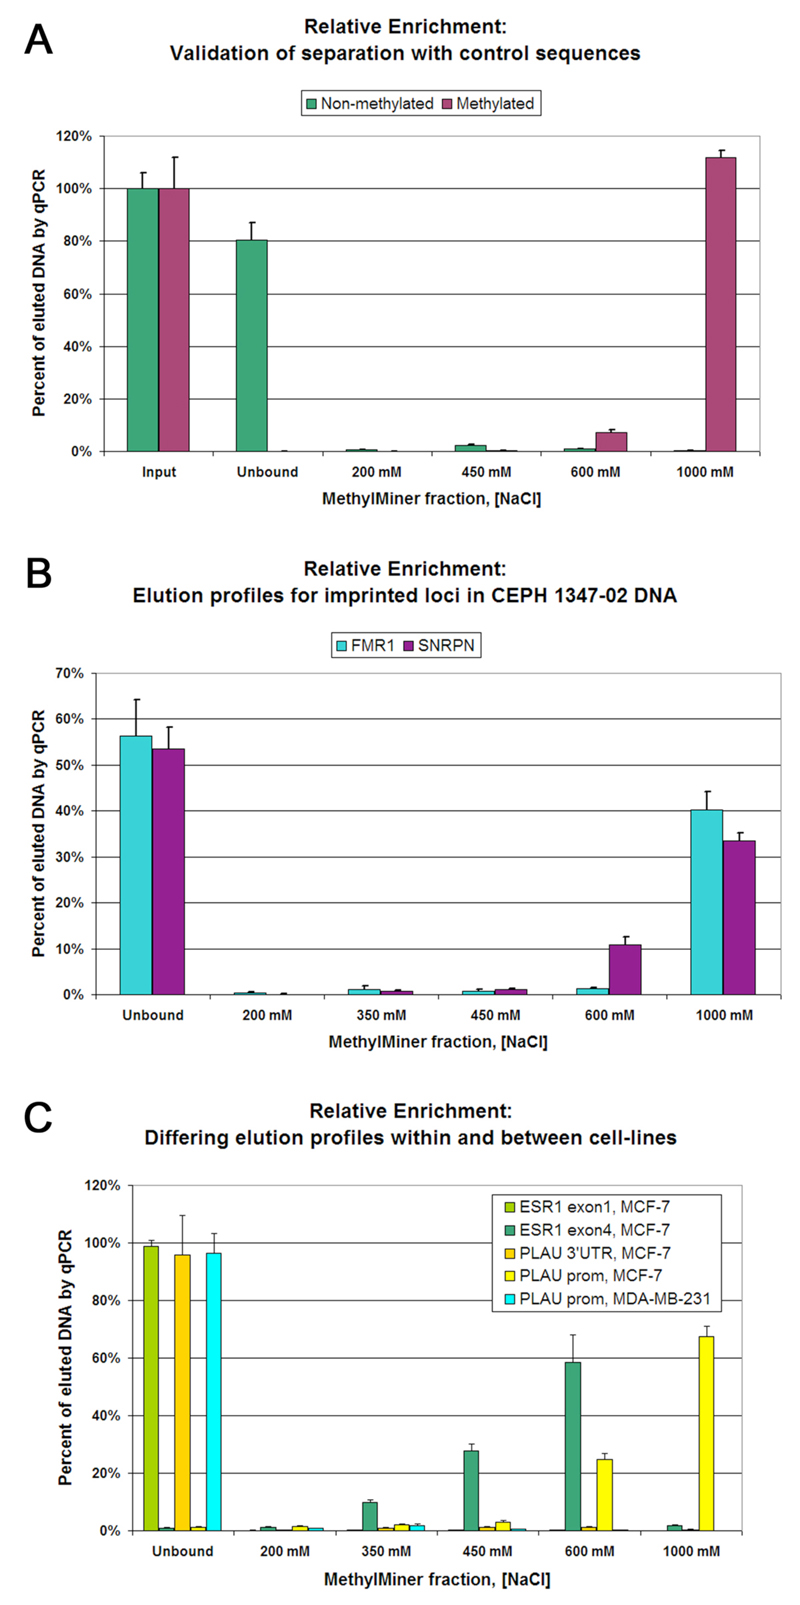
Chapter 9. Figure 4. Relative enrichment analyses of MethylMiner-based separation of non-methylated and methylated sequences. A) Elution profiles of the alien non-methylated and methylated synthetic control duplex DNAs provided in the MethylMiner kit. In triplicate, 10 pg of each duplex was spiked into a background of 1 μg of fragmented K-562 DNA prior to enrichment. Values are determined by reference to a standard curve of the Cts of input DNA determined by qPCR; signal magnitude for 10 pg of each duplex (input) is 100%. B) Relative enrichment profiles from CEPH 1347-02 cell DNA for two imprinted loci were measured in triplicate. As expected, approximately 50% of the amplifiable DNA for each locus is enriched (methylated alleles) and approx. 50% fails to bind (non-methylated alleles). C) Distinct relative enrichment profiles for several different genomic loci were measured in triplicate. In MCF-7 cells, the ESR1 exon1 locus is evidently non-methylated (light green bars) while the ESR1 exon4 locus is apparently partially methylated (dark green bars). Also in MCF-7 DNA the 3' UTR locus shows no evidence of methylation (orange bars). Matching the data shown in figure 2, the PLAU locus (amplicon 1) is heavily methylated in MCF-7 cells (yellow bars) and poorly methylated in MDA-MB-231 cells (light blue bars).
Further reading at PCR Troubleshooting and Optimization. More figures at PCR Figures.