PCR Troubleshooting and Optimization Figure
|
Edited by: Suzanne Kennedy and Nick Oswald Published: 2011 ISBN: 978-1-904455-72-1 An essential book for all scientists using PCR, real-time PCR, qPCR and related techniques. read more ... |
Figure from: PCR Troubleshooting and Optimization
Full details of this book at PCR Troubleshooting and Optimization. More figures at PCR Figures.
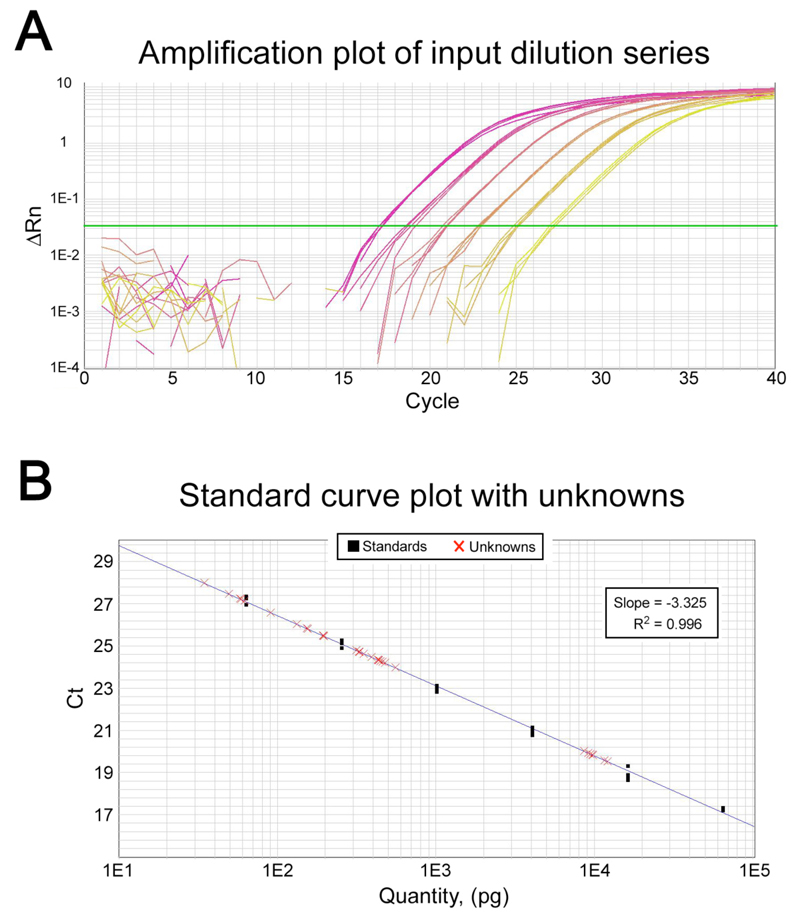
Chapter 9. Figure 3. qPCR data from non-enriched DNA (input) is used to evaluate amplicon-specific sequence enrichment. A) Plot of quadruplicate measurements of amplification of a 4-fold dilution series of input DNA (64 ng to 62.5 pg) with an amplicon-specific pair of primers. B) A linear curve-fit of Ct vs. mass of input DNA (black squares) shows good efficiency (slope = -3.325) and linearity of response (R2 = 0.996). Cts for unknown samples (portions of enrichment fractions) are plotted as red Xs and an equivalent mass of input is determined by interpolation and limited extrapolation. These values are use to determine relative enrichment and, when the mass of the DNA in enrichment fractions is measured independently, absolute enrichment (see text).
Further reading at PCR Troubleshooting and Optimization. More figures at PCR Figures.