PCR Troubleshooting and Optimization Figure
|
Edited by: Suzanne Kennedy and Nick Oswald Published: 2011 ISBN: 978-1-904455-72-1 An essential book for all scientists using PCR, real-time PCR, qPCR and related techniques. read more ... |
Figure from: PCR Troubleshooting and Optimization
Full details of this book at PCR Troubleshooting and Optimization. More figures at PCR Figures.
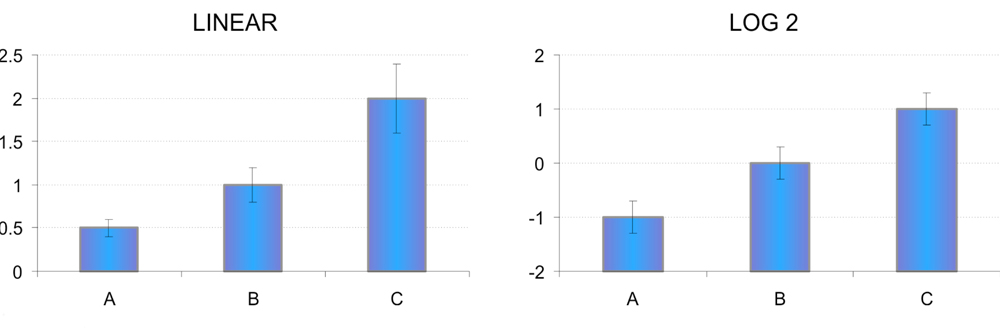
Chapter 7. Figure 5. The left panel shows the NRQ value of a target gene for 3 samples (A, B and C) in linear scale. While sample A has a 2-times lower expression compared to sample B, sample C has a 2-fold higher expression compared to sample B. Doing relative quantification, we understand that sample A is as different from sample B as is sample C (i.e. a 2-fold difference), However, in linear scale, sample C appears more distant (1 unit) from sample B as does sample A (0.5 units). This creates a problem when using a statistical test (e.g. t-test) that relies on the absolute difference. A simple workaround is to log transform the data (here base-2 logarithm, but any base is fine). In the right panel, sample C and A are equally distant from sample B (i.e. 1 base-2 log unit). Please note that specific error propagation rules are required to go from error bar values in linear scale to error bars on the log transformed bars.
Further reading at PCR Troubleshooting and Optimization. More figures at PCR Figures.