PCR Troubleshooting and Optimization Figure
|
Edited by: Suzanne Kennedy and Nick Oswald Published: 2011 ISBN: 978-1-904455-72-1 An essential book for all scientists using PCR, real-time PCR, qPCR and related techniques. read more ... |
Figure from: PCR Troubleshooting and Optimization
Full details of this book at PCR Troubleshooting and Optimization. More figures at PCR Figures.
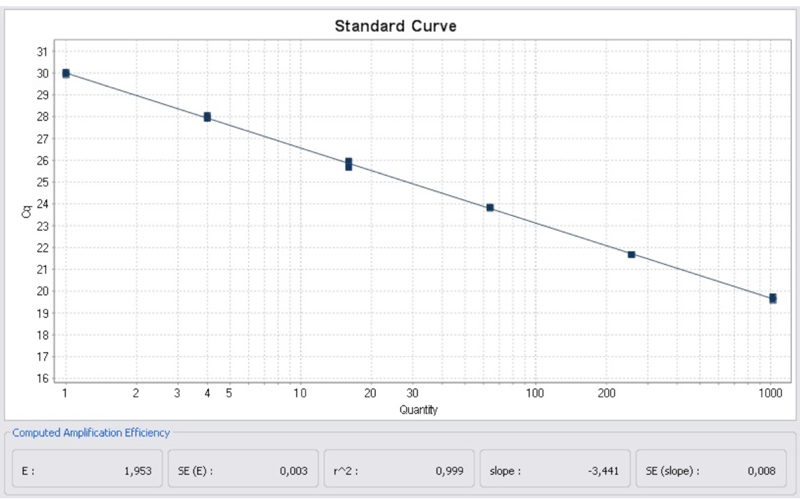
Chapter 7. Figure 2. Typical standard curve obtained from a 6-point 4-fold dilution series for an assay with a good amplification efficiency (E=1.953, efficiency=95.3%) as calculated by qbasePLUS. A high correlation coefficient (r2=0.999) and low error on the estimated efficiency (SE(E)=0.3%) indicate a high quality standard curve from which reliable efficiency estimations can be drawn.
Further reading at PCR Troubleshooting and Optimization. More figures at PCR Figures.