PCR Troubleshooting and Optimization Figure
|
Edited by: Suzanne Kennedy and Nick Oswald Published: 2011 ISBN: 978-1-904455-72-1 An essential book for all scientists using PCR, real-time PCR, qPCR and related techniques. read more ... |
Figure from: PCR Troubleshooting and Optimization
Full details of this book at PCR Troubleshooting and Optimization. More figures at PCR Figures.
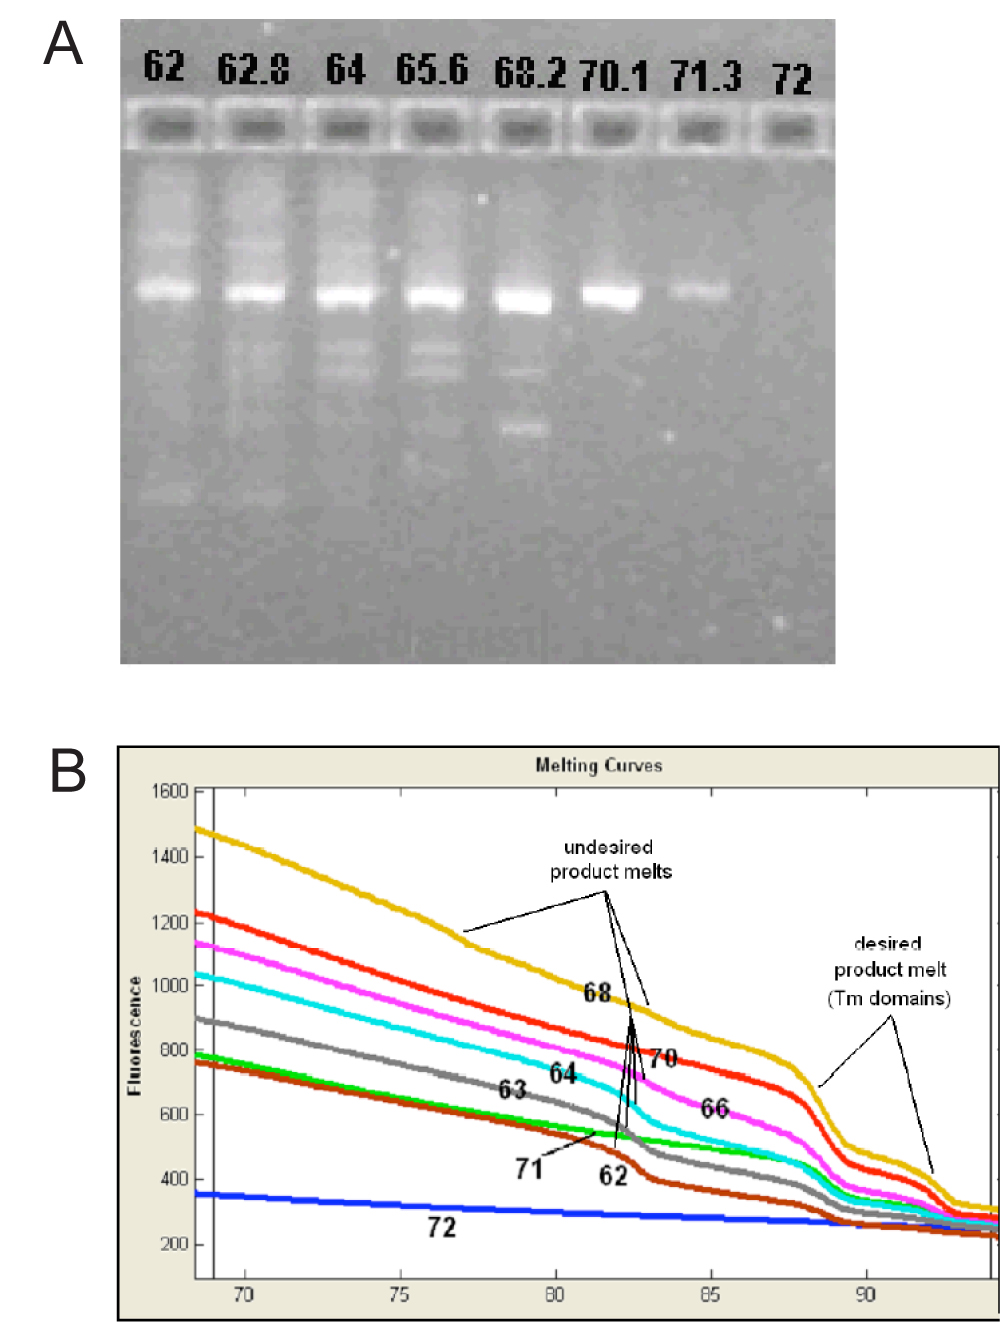
Chapter 4. Figure 8. Gradient annealing optimization. Optimizing for maximum sensitivity can include gel and melting analysis. The gel image correlates with the melting profiles. Gel analysis enables identification of candidate conditions for PCR. In this example, annealing temperatures of 62 C - 68.2 C show undesired products as visualized by extra bands. 71.3 C and 72 C generate faint single bands, while 70.1 C generates a robust single band, the best annealing temperature for PCR using this primer set. Corresponding melting profiles support the gel results showing undesired (often referred to as nonspecific) product at the lower temperatures and the desired product melting profile at 70.1 C.
Further reading at PCR Troubleshooting and Optimization. More figures at PCR Figures.