PCR Troubleshooting and Optimization Figure
|
Edited by: Suzanne Kennedy and Nick Oswald Published: 2011 ISBN: 978-1-904455-72-1 An essential book for all scientists using PCR, real-time PCR, qPCR and related techniques. read more ... |
Figure from: PCR Troubleshooting and Optimization
Full details of this book at PCR Troubleshooting and Optimization. More figures at PCR Figures.
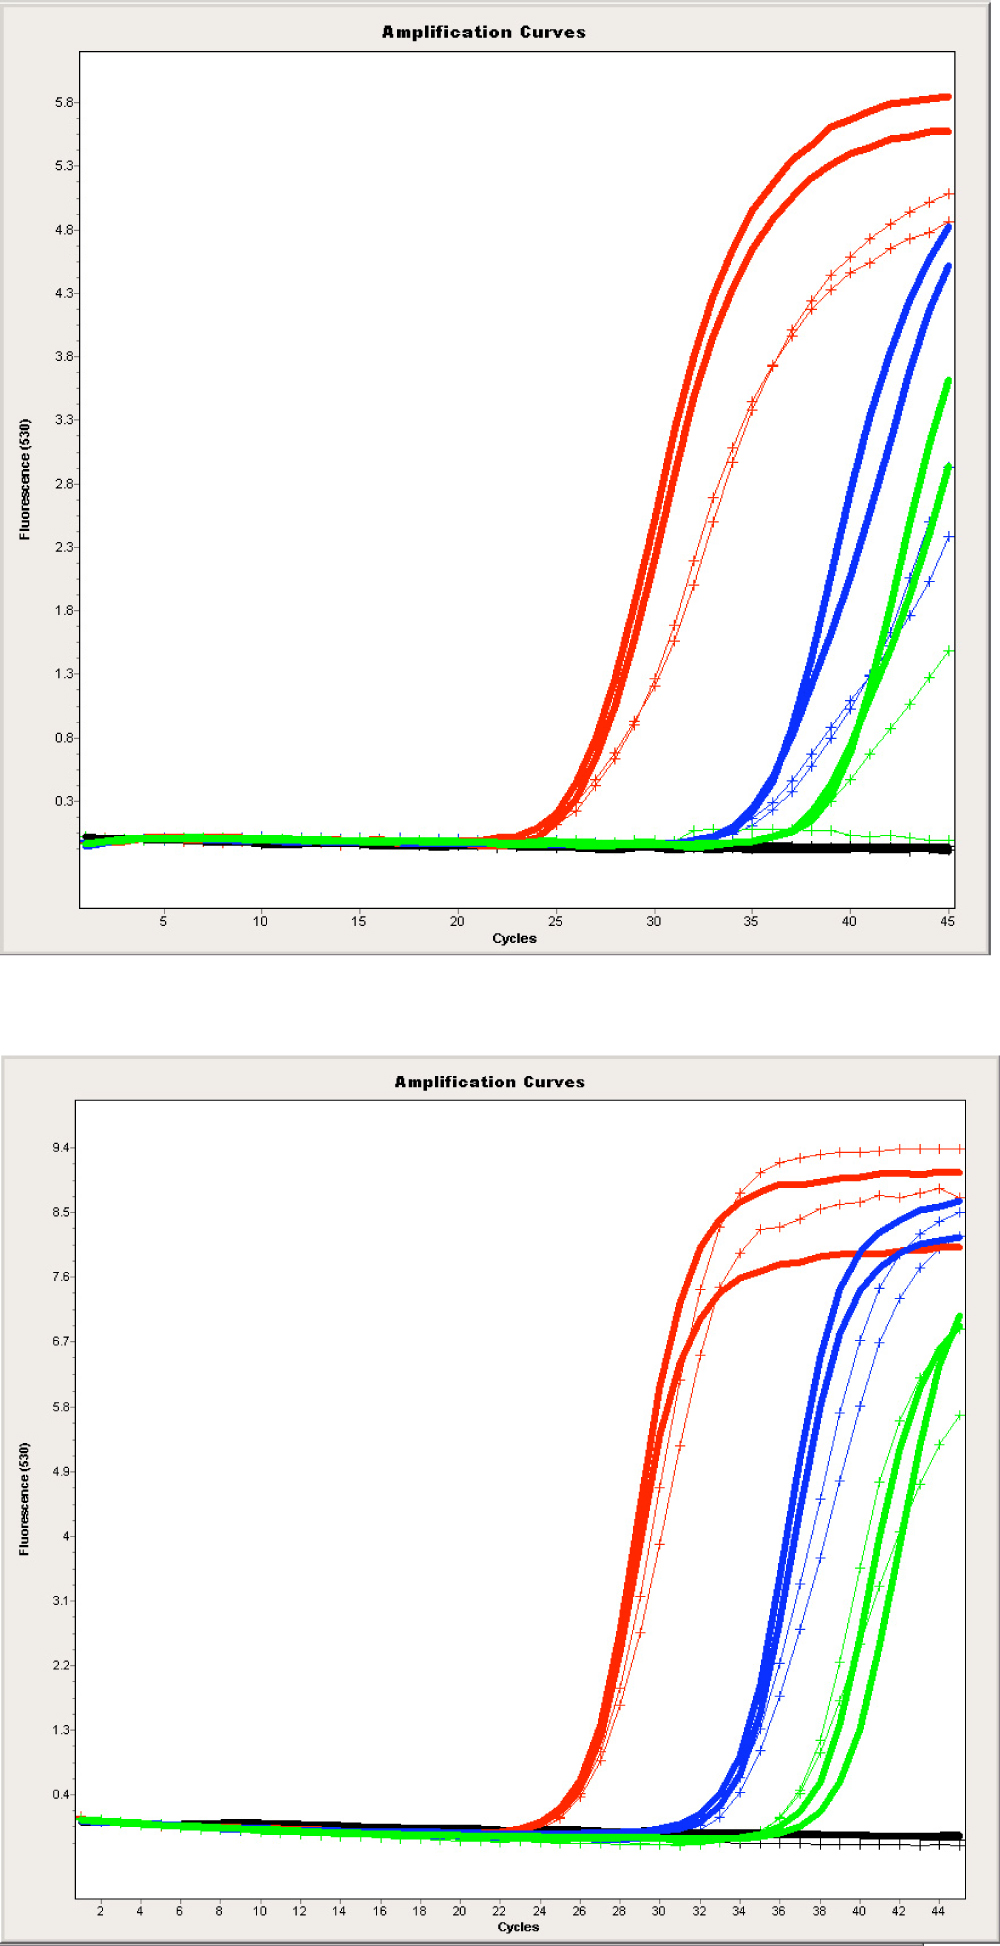
Chapter 4. Figure 5. Amplification curves of two hydrolysis probe targets. The red traces contained 10,000 genomic equivalents (GE) of microorganism template DNA, blue contained 50 GE, and green contained 5 GE. Black traces contained no microorganism DNA. Additional human DNA (1.5 μg) was added in samples represented by hatches. These hydrolysis probe reactions demonstrate inherent differences in their ability to tolerate excess non-template DNA. In assay 1 (the upper panel), LOD is compromised, represented by one negative reaction and one positive. In assay 2 (the lower paned) LOD is not affected by the same additional amount of non-template human DNA.
Further reading at PCR Troubleshooting and Optimization. More figures at PCR Figures.