PCR Troubleshooting and Optimization Figure
|
Edited by: Suzanne Kennedy and Nick Oswald Published: 2011 ISBN: 978-1-904455-72-1 An essential book for all scientists using PCR, real-time PCR, qPCR and related techniques. read more ... |
Figure from: PCR Troubleshooting and Optimization
Full details of this book at PCR Troubleshooting and Optimization. More figures at PCR Figures.
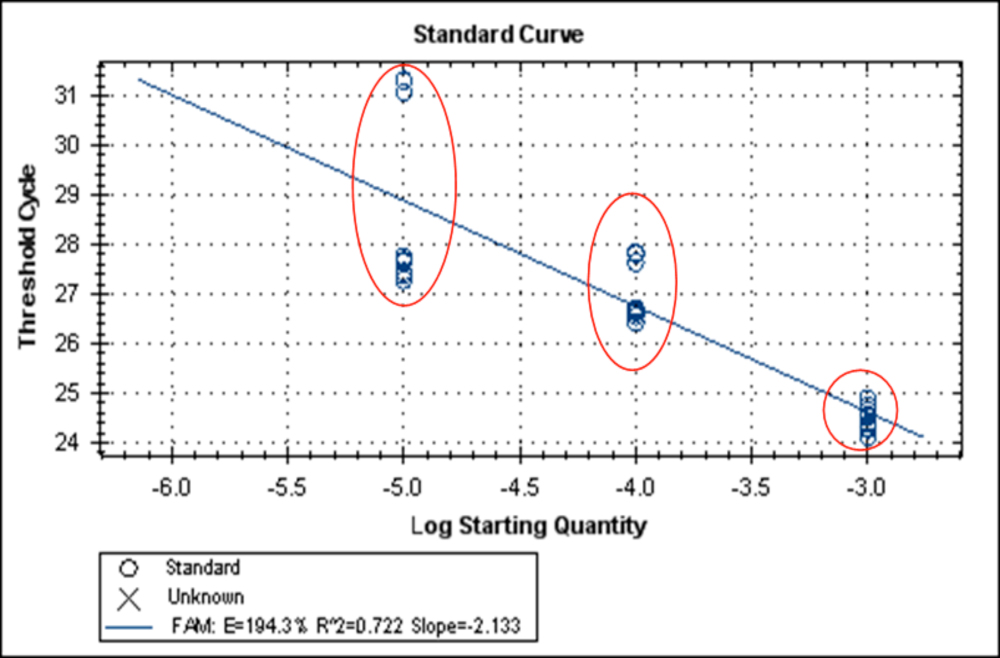
Chapter 3. Figure 2. A screenshot from BioRad CFX software showing example of a bad standard curve. PCR efficiency was measured as 194.5% across three out of four 10-fold template dilutions. The slope of the curve was calculated as -2.133 and the R2 value as 0.722. Red circles are drawn to highlight replicate samples giving inconsistent Cq values, a potential outcome of inaccurate pipetting.
Further reading at PCR Troubleshooting and Optimization. More figures at PCR Figures.