PCR Troubleshooting and Optimization Figure
|
Edited by: Suzanne Kennedy and Nick Oswald Published: 2011 ISBN: 978-1-904455-72-1 An essential book for all scientists using PCR, real-time PCR, qPCR and related techniques. read more ... |
Figure from: PCR Troubleshooting and Optimization
Full details of this book at PCR Troubleshooting and Optimization. More figures at PCR Figures.
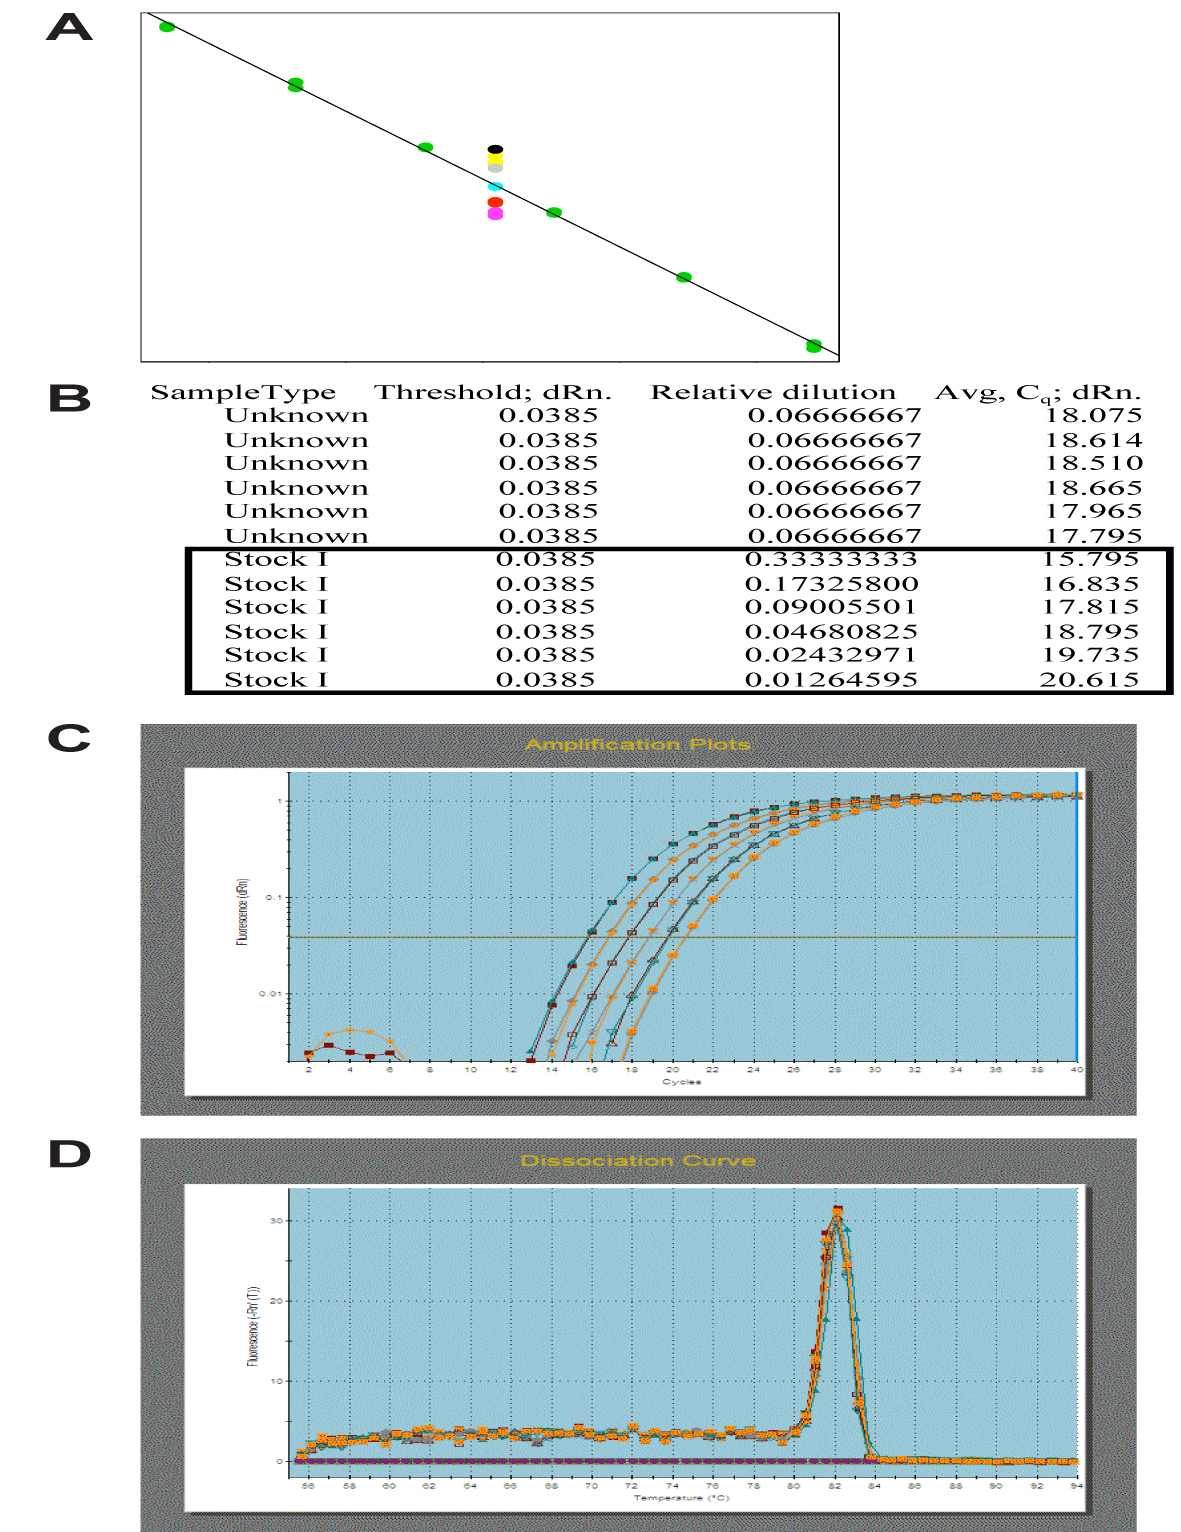
Chapter 2. Figure 4. Example of a SYBR-Green based assay using P-Q to establish the good, valid dynamic dilution range for samples and standards. Shown is the standard curve for a single target which was generated using an experimental sample mixture; a small portion of each sample was mixed to form the assay's "Stock I" (the sample amplified with 96.9% efficiency according to the slope of this standard curve). A.) Graph of the standard curve for PS7r1 using the Stock I sample mixture, and Cq values of 6 unknowns (duplicate Cq values plotted). B.) P-Q-identified valid Stock I dilution range (in black rectangle) and associated real-time qPCR (averaged duplicate) values generated for PS7r1 using a one-step SYBR Green-based qPCR method (averaged Cq values shown). C.) The associated Stratagene Mx3005P amplification plots for PS7r1 at the six chosen Stock I dilutions (each performed in duplicate). D.) The Mx3005P dissociation curve analysis for this run.
Further reading at PCR Troubleshooting and Optimization. More figures at PCR Figures.