PCR Troubleshooting and Optimization Figure
|
Edited by: Suzanne Kennedy and Nick Oswald Published: 2011 ISBN: 978-1-904455-72-1 An essential book for all scientists using PCR, real-time PCR, qPCR and related techniques. read more ... |
Figure from: PCR Troubleshooting and Optimization
Full details of this book at PCR Troubleshooting and Optimization. More figures at PCR Figures.
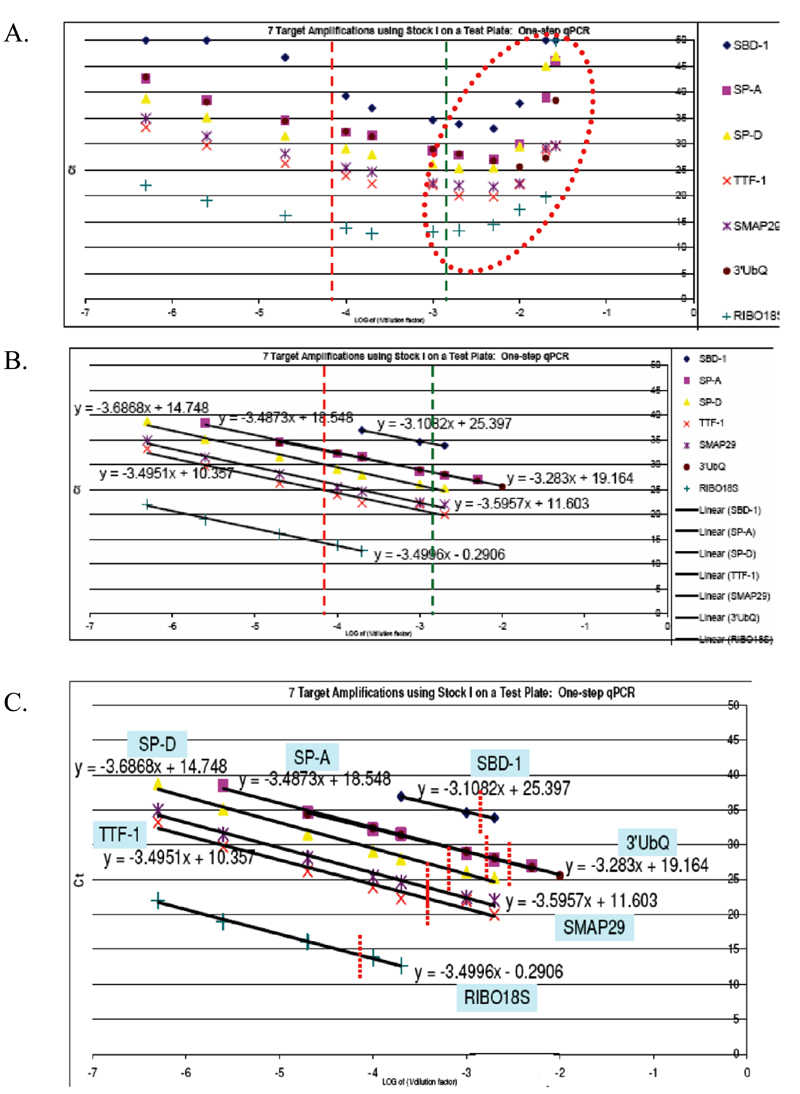
Chapter 2. Figure 2. A Stock I dilution series exposing the "inhibitory characteristic" for a group of sheep total lung RNA samples isolated by TRIzol. A portion of 56 experimental samples was mixed to create the Stock I sample, and the inhibitory characteristic of the sample group for each of seven targets was examined on a Test Plate. A.) The inhibitory characteristic regions are roughly circled in red. B.) The P-Q-resolved valid dilution ranges for each of the seven targets. C.) The small vertical red lines represent where P-Q calculates each of the 56 samples to be used within each target's respective valid standard curve range. This line represents a particular ng/μl in-well concentration of sample in each case.
Further reading at PCR Troubleshooting and Optimization. More figures at PCR Figures.