PCR Troubleshooting and Optimization Figure
|
Edited by: Suzanne Kennedy and Nick Oswald Published: 2011 ISBN: 978-1-904455-72-1 An essential book for all scientists using PCR, real-time PCR, qPCR and related techniques. read more ... |
Figure from: PCR Troubleshooting and Optimization
Full details of this book at PCR Troubleshooting and Optimization. More figures at PCR Figures.
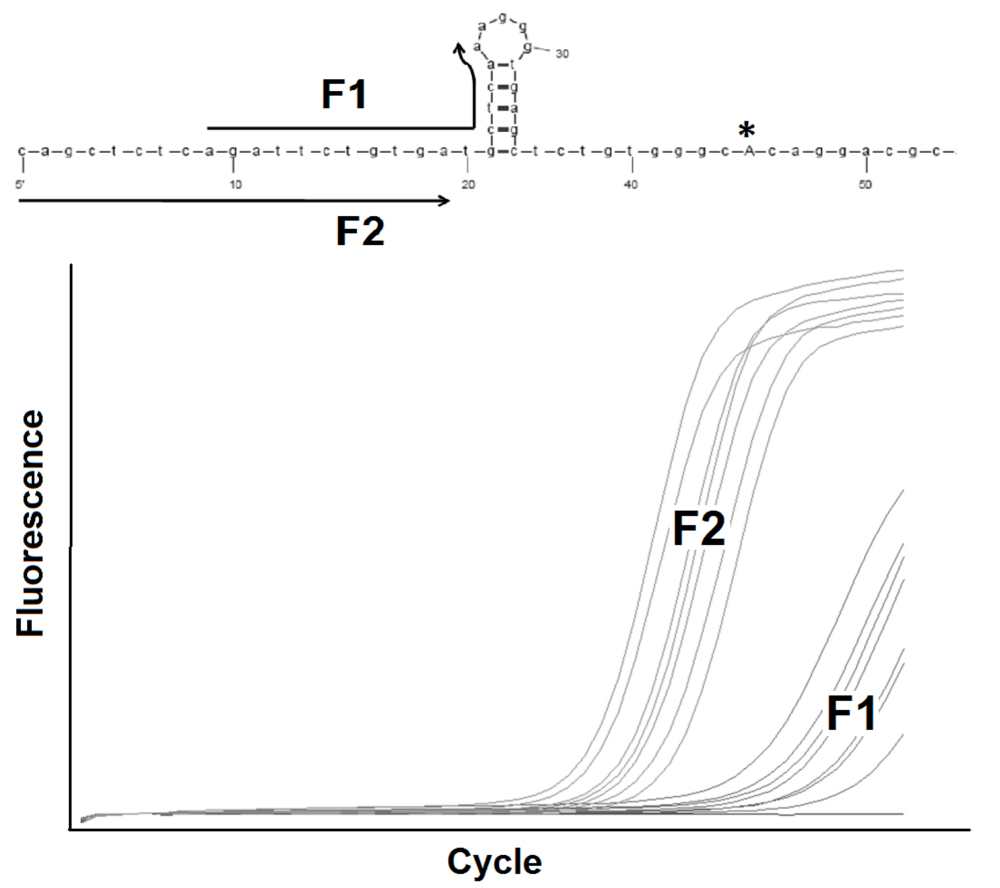
Chapter 10. Figure 6. The effect of secondary structure at the 3' end of a primer. On top, two alternative primers (F1 and F2) are shown with identical Tms of 59 C. The F1 primer region forms a loop structure while the F2 region has no secondary structure as predicted by mfold at 55 C, the assay annealing temperature. The reverse primer was the same in both cases and an asterisk indicates the targeted SNP. Below, the real time growth curves of several samples are shown, amplified with either F1or F2 forward primers.
Further reading at PCR Troubleshooting and Optimization. More figures at PCR Figures.