PCR Troubleshooting and Optimization Figure
|
Edited by: Suzanne Kennedy and Nick Oswald Published: 2011 ISBN: 978-1-904455-72-1 An essential book for all scientists using PCR, real-time PCR, qPCR and related techniques. read more ... |
Figure from: PCR Troubleshooting and Optimization
Full details of this book at PCR Troubleshooting and Optimization. More figures at PCR Figures.
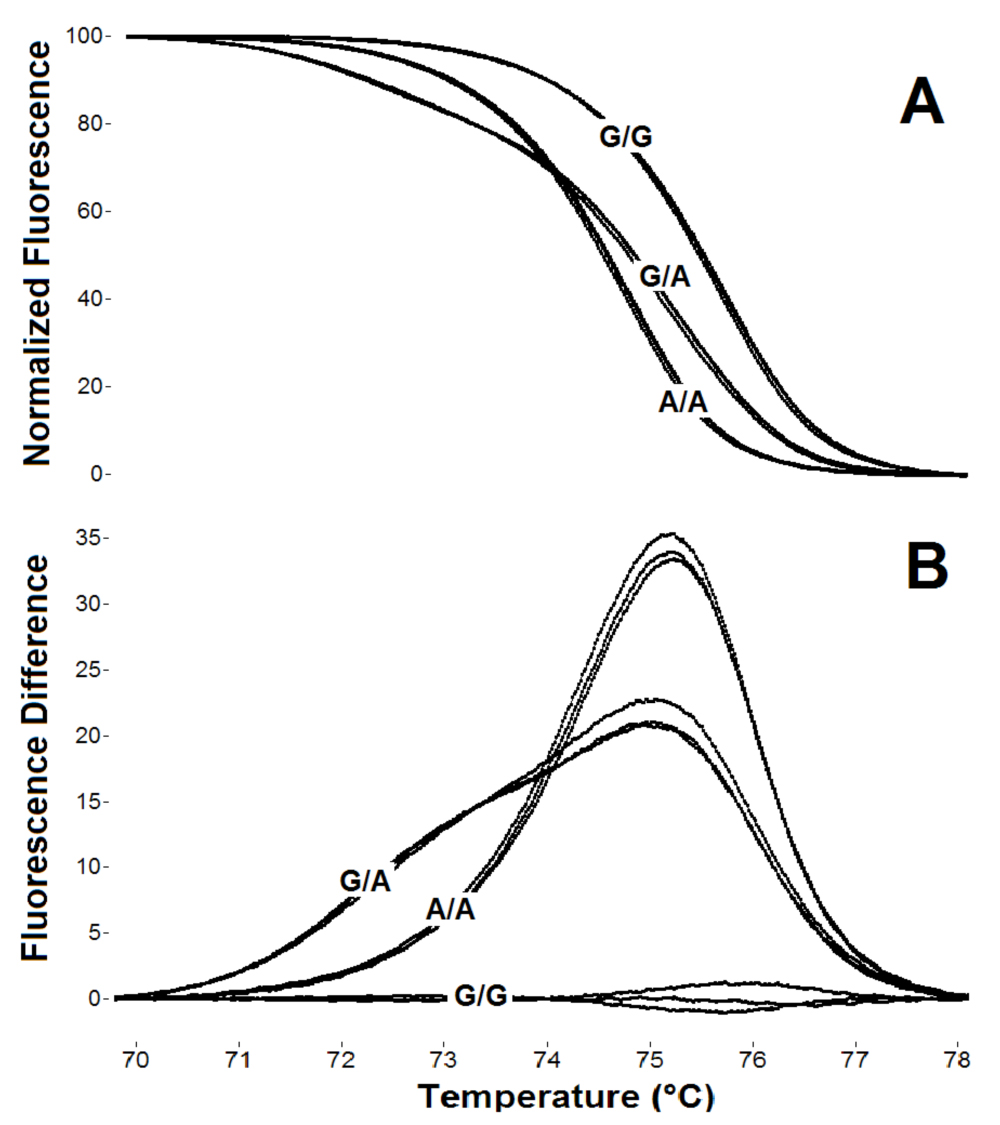
Chapter 10. Figure 2. Basic software analysis for HRMA genotyping. Fluorescent normalization of melting curves before and after the amplicon melting transition is shown in (A) with difference plots of the same data shown in (B). Three samples of each genotype are analyzed using a 42 bp product bracketing the FV Leiden locus (1691G>A).
Further reading at PCR Troubleshooting and Optimization. More figures at PCR Figures.