Real-Time PCR Quantification Analysis
Typically, an amplification curve presents three different phases (Figure 11).

The first is called the initiation phase, it occurs during the first PCR cycles where the emitted fluorescence can not be distinguished from the baseline. During the exponential or log phase there is an exponential increase in fluorescence, before the plateau phase is reached. In this last phase, the reagents are exhausted, and no increase in fluorescence is observed. Only in the exponential phase, quantification is possible Rodriguez-Lazaro and Hernandez, 2013.
Quantification Analysis in qPCR
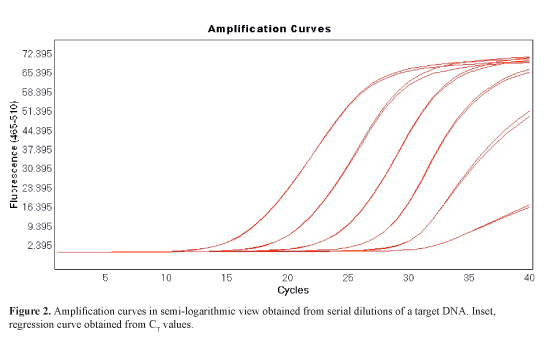
A fluorophore (so-called passive reference) may be present in the PCR buffer in order to well-to-well normalize the fluorescence. This helps to overcome the effects of pipetting errors. This normalization is accomplished by dividing the emission intensity of the reporter dye by the emission intensity of the passive reference to obtain a ratio, i.e. Rn (normalized reporter) for any given reaction. At any given cycle, Rn+ is the Rn value of a reaction containing all components including the template and Rn- is the Rn value of an unreacted sample obtained from the early cycles of the PCR, i.e., those prior to a detectable increase in fluorescence, or from a reaction not containing template. The ΔRn is the difference between the Rn at the end point (Rn+) and at the starting point (Rn-). It reliably indicates the magnitude of the signal generated by the given set of PCR conditions, and is proportional to the DNA amount during the exponential phase. The fluorescence emitted in the first cycles is used to calculate the baseline. A threshold is established at the fluorescence value of the average standard deviation of Rn for the baseline cycles, multiplied by an adjustable factor (usually ten times). Alternatively, it can be established by the operator in order to compare different qPCR experiments. The Cp (crossing point-PCR-cycle) or CT (threshold cycle) value is the cycle at which fluorescence achieves a defined threshold. It corresponds to the cycle at which a statistically significant increase in fluoresnce (ΔRn or non-normalised) is first detected. This concept is the basics for accurate and reproducible quantification using qPCR; the number of cycles needed for the amplification-associated fluorescence to reach a specific threshold level of detection (the CT or Cp value) is inversely correlated to the amount of nucleic acid that was in the original sample (Rodriguez-Lazaro and Hernandez, 2013). This value always is in the exponential phase of amplification, when amplification is most efficient, and therefore quantification is least affected by reaction-limiting conditions.The quantity of DNA at the start of the PCR can then be determined by interpolation of the resulting CT or Cp value in a linear standard curve of values obtained from serially diluted known-amount standards (Figure 12).

This standard curve correlates the emitted fluorescence (CT or Cp value) with the initial concentration of the standards used and the final result is achieved by interpolation of the produced fluorescence (CT or Cp value) during the amplification of the sample in this standard curve. In practice, such curves are linear over more than five orders of magnitude Rodriguez-Lazaro and Hernandez, 2013.
Reference
Rodríguez-Lázaro, D. and Hernández, M. (2013). Introduction to the Real-time PCR In Real-Time PCR in Food Science: Current Technology and Applications. D. Rodriguez-Lazaro, ed. (Norfolk, UK: Caister Academic Press). ISBN: 978-1-908230-15-7.Further reading
- Real-Time PCR: Advanced Technologies and Applications
- Real-Time PCR in Food Science: Current Technology and Applications
- Quantitative Real-time PCR in Applied Microbiology